Course Information
Course Structure
Trainer
Level
Cost
Data is everywhere. It’s on our phones, in our homes, on the streets and in the skies. But sometimes it can be hard to get a handle on what all that data means – especially when you’re trying to present it in an accessible way. That’s where Virtualitics comes in!
Course Content
About the workshop:
Imagine a world where you could see your data in front of you, in 3D, and interact with it. Virtualitics’ AI platform allows organisations to rapidly process complex data into powerful multi-dimensional graph visualizations, and predict future business outcomes with clear, explainable no-code AI modelling.
With their Shared Virtual Office feature, there’s a possibility to turn VR systems into teleconferencing rooms where employees can discuss insights from data while having it life-sized in front of them. As a business owner, you’ll have the opportunity to discover and see that you need a dozen VR headsets to get going with the software, as Virtualitics is pushing experiences on desktop and mobile, as well.
What you will learn:
3D visualisations are an emerging technology that offer new ways to view, manipulate and interact with complex data. This technology also provides assistance with identifying different variables, anomalies and relationships, extracting key insights with ease.
You will also learn:
Why the gap between the analytics teams and the business has prevented AI success
Why visualisations are critical to getting the business and the analytics teams aligned and to build trust
How the practical application of AI can be made easy for everyday people to trust, and leverage
During the workshop
During this workshop, you’ll discover how to use machine learning models to quickly find and visualise relationships among hundreds of variables to understand the ones that drive your problem at hand. As an attendee, you will also have a chance to see how to better interact with data through ad hoc visualisations in 3D and VR.
You’ll even get an opportunity to see some use cases where teams collaborate across different geographic locations, interacting and analyzing data together—which is much more effective than exchanging PDFs or screen sharing!
Benefits & outcomes:
VR data visualisation is the next step in the evolution of business intelligence platforms. This technology allows companies to gain a deeper level of understanding of the stories being told by their raw data, and this is only possible because of the collaborative nature of virtual reality.
Incorporating VR into an office scenario could be one way for office workers to experience some of the benefits of in-person collaboration with coworkers, as those who commute to physical locations have. This could easily be the solution you have been searching for to the push-back in the professional world to going back to work, as remote work powered by AI/VR/AR technology could be a game-changer.
Who is the course for?
If you have experience with data analysis tools, Virtualitics AI-based platform will help you build trust between your team and the business by providing insights into how best to approach problems. If this is new territory for you, it will empower you to make better decisions based on reliable data insights.
Workshop Dates
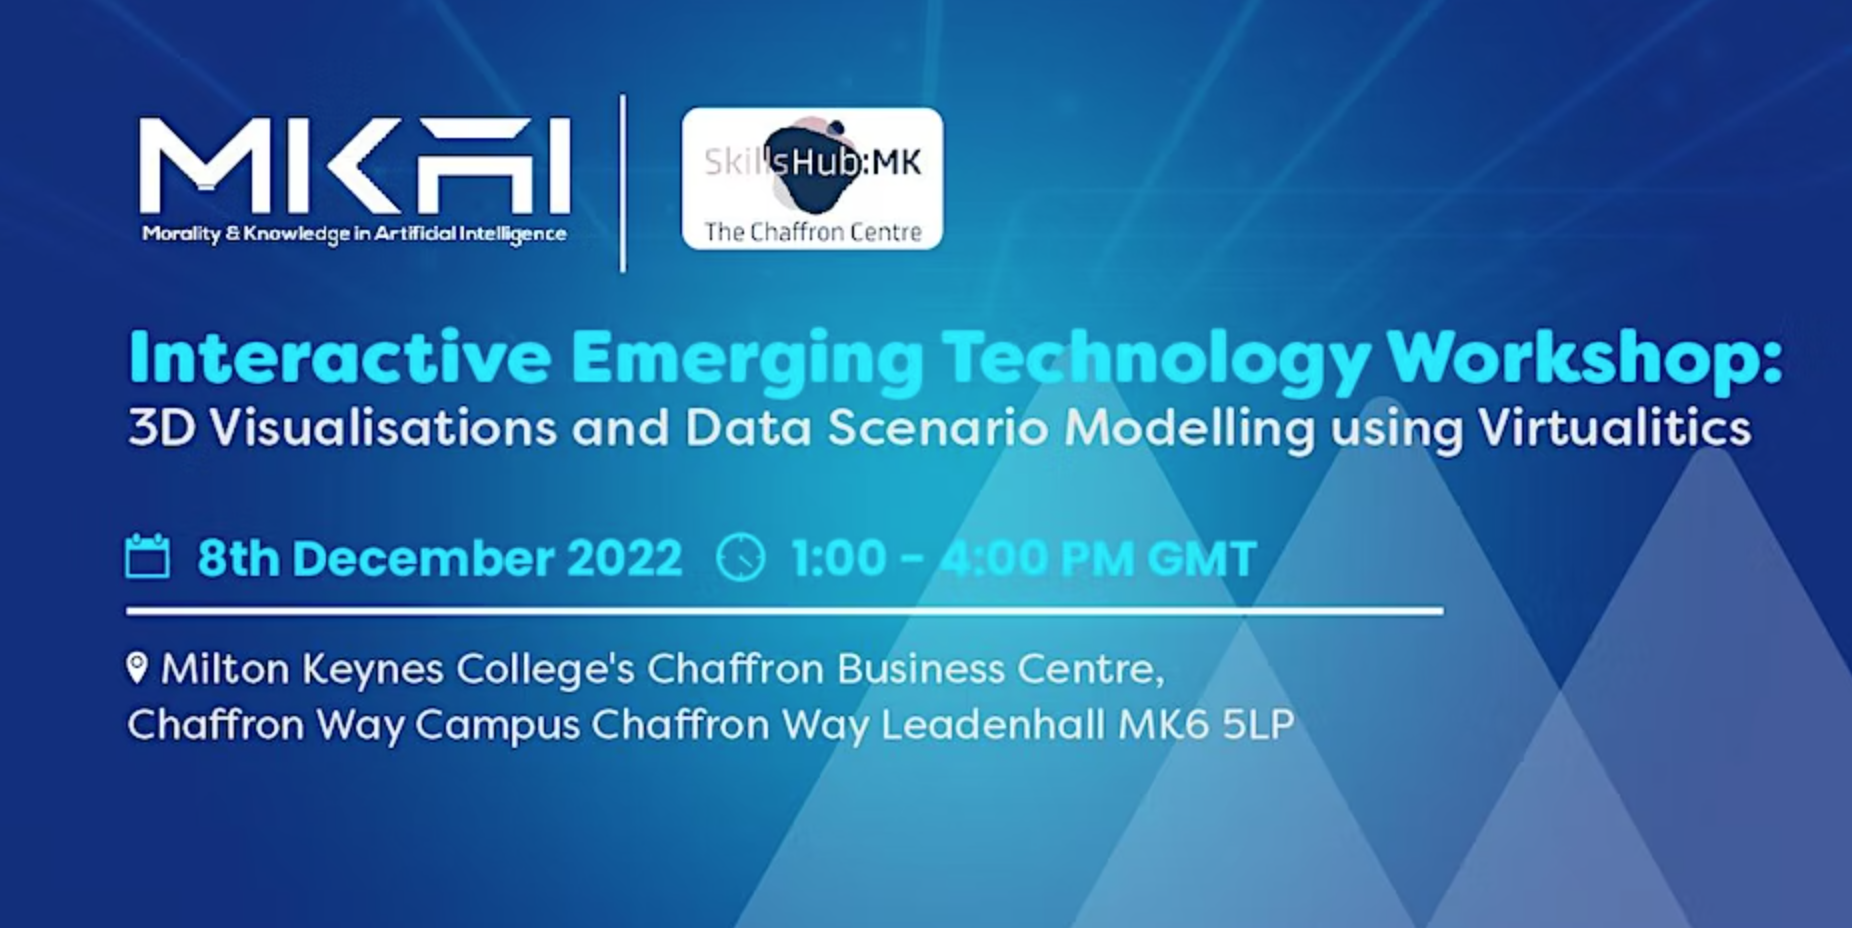
Join us on 8th December 1-4 pm at Chaffron Business Centre for Part 5 of MKAI’s Interactive Emerging Technology workshop series with SkillsHub:MK and learn about the platform that brings machine learning, big data and immersive visualisation together to explore data like never before!
| Workshop | Date | Duration | Location | Book |
MKAI Emerging Technology Workshop: 3D Visualisations and Data Scenario Modelling

